
Pass rates and waits
Driving test centres in Great Britain
DVSA figures for 2025/26.
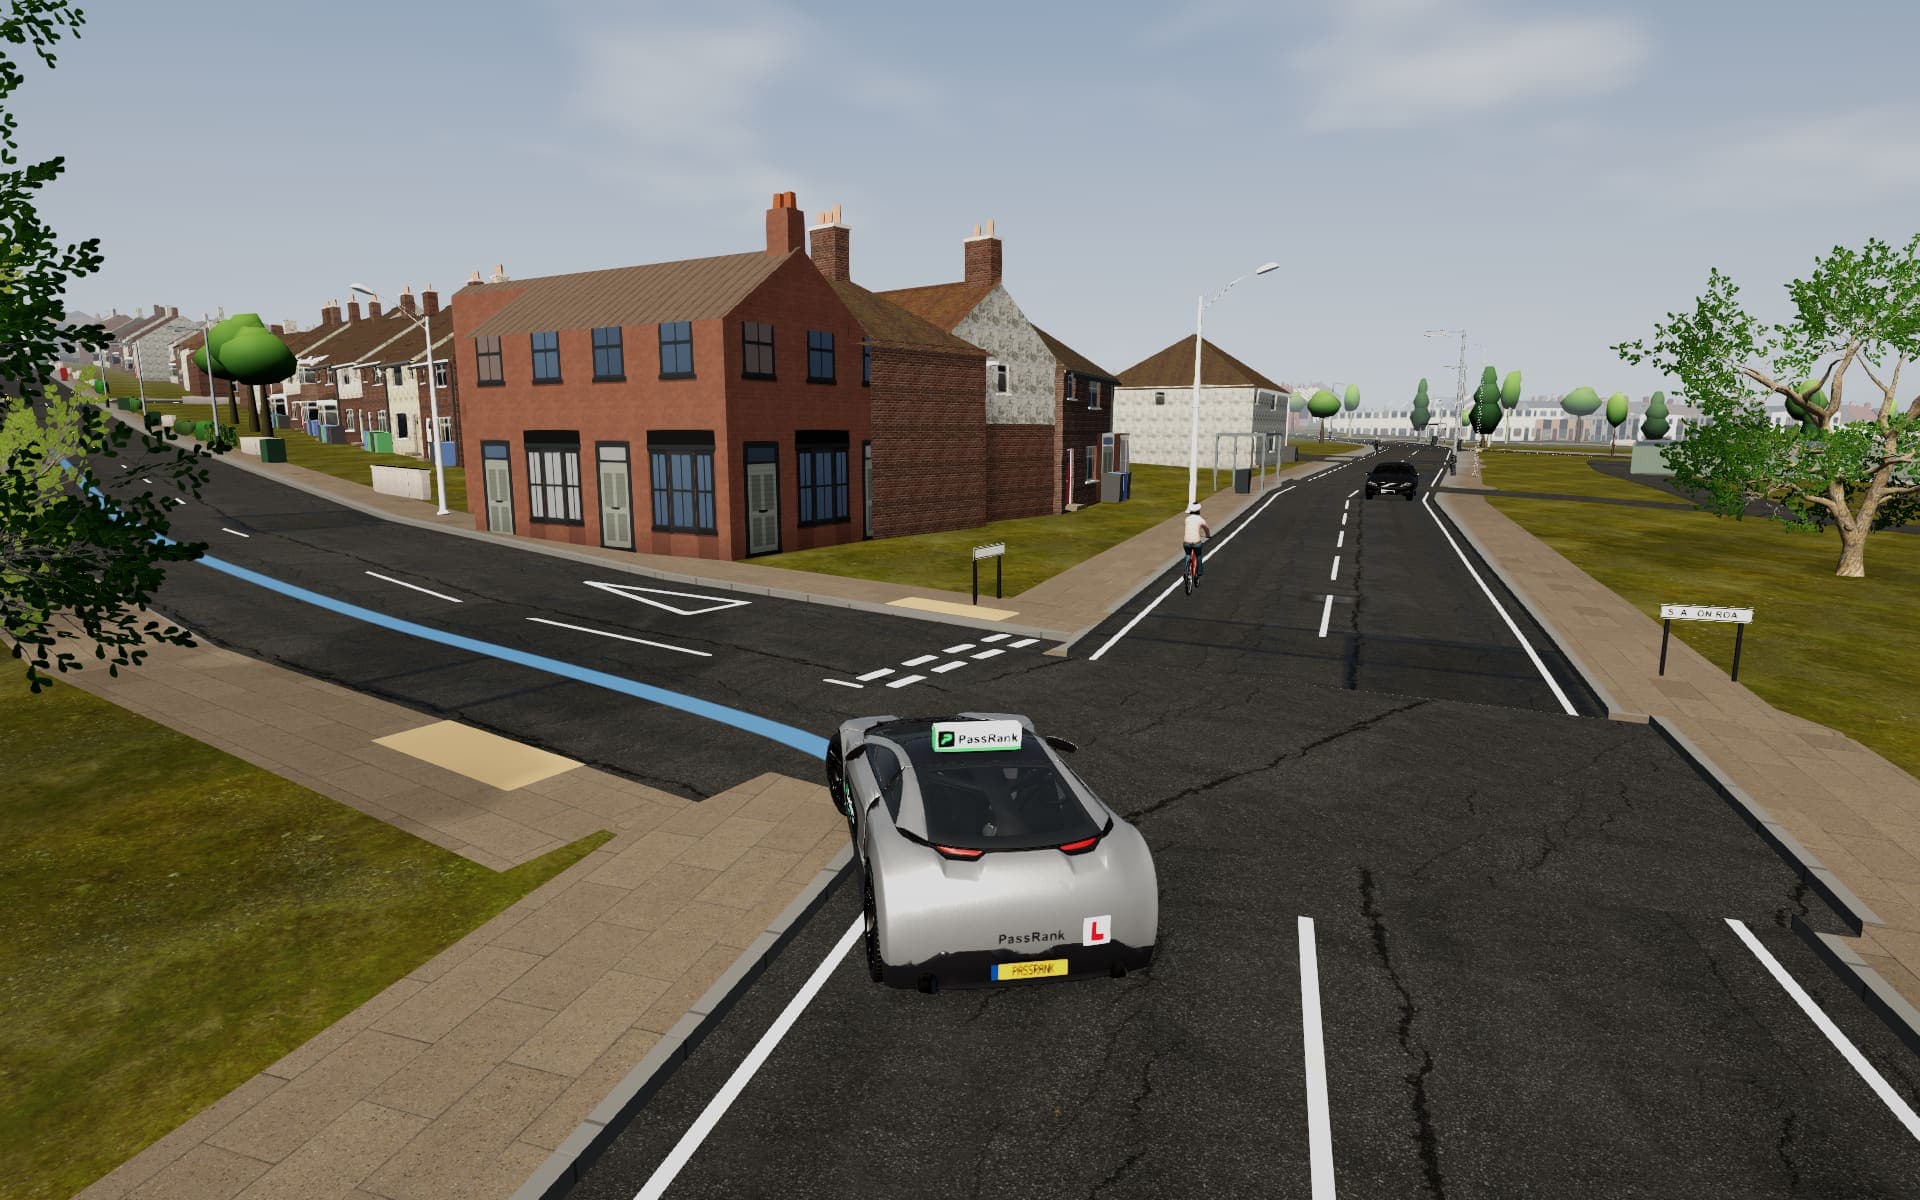
Drive the routes at your test centre.
Pick your centre and save it: its routes then show here, ready to drive.
Pick a region
11 regions- East Midlands20 centres · 12.2 wks50.8%
- East of England24 centres · 12.4 wks51.4%
- London24 centres · 14.6 wks49.1%
- North East11 centres · 15.1 wks48.4%
- North West31 centres · 12.1 wks49.0%
- Scotland83 centres · 17.4 wks49.3%
- South East31 centres · 11 wks52.9%
- South West22 centres · 9.7 wks51.7%
- Wales21 centres · 7.3 wks52.4%
- West Midlands27 centres · 11.9 wks46.2%
- Yorkshire and The Humber27 centres · 13.4 wks50.4%
East Midlands
Region average 50.8% · median wait 12.2 weeks
- 1Melton MowbrayLE13 0UL69.7%Wait 20 wks
- 2WellingboroughNN8 3RU60.0%Wait 18 wks
- 3BuxtonSK17 9DS58.7%Wait 17.4 wks
- 4Grantham (Somerby)Grantham · NG31 7TX57.9%Wait 18.4 wks
- 5AshfieldSutton-in-Ashfield · NG17 5LA57.3%Wait 15.3 wks
East of England
Region average 51.4% · median wait 12.4 weeks
- 1IpswichIP3 9SW62.3%Wait 5.3 wks
- 2Norwich (Peachman Way)Norwich · NR7 0WE61.7%Wait 9 wks
- 3LetchworthSG6 1RF57.5%Wait 21 wks
- 4Chelmsford (Hanbury Road)Chelmsford · CM1 2PZ55.4%Wait 20.9 wks
- 5StevenageSG1 3DT55.3%Wait 3.7 wks
London
Region average 49.1% · median wait 14.6 weeks
- 1Sidcup (London)Sidcup · DA14 5AG58.7%Wait 23 wks
- 2Enfield (Innova Business Park)Enfield · EN3 7XY53.9%Wait 2.4 wks
- 3Tolworth (London)Tolworth · KT6 7RZ53.6%Wait 23.1 wks
- 4Bromley (London)BROMLEY · BR1 5AB52.9%Wait 7.9 wks
- 5Yeading (London)Yeading · UB4 9BS52.8%Wait 3 wks
North East
Region average 48.4% · median wait 15.1 weeks
- 1AlnwickNE66 1JX55.5%Wait 14.6 wks
- 2Berwick-On-TweedBerwick-upon-Tweed · TD15 2UY53.9%Wait 22.1 wks
- 3DurhamMeadowfield · DH7 8XL53.2%Wait 15.9 wks
- 4HexhamNE46 3EW53.0%Wait 17.9 wks
- 5SunderlandSR5 3JJ51.1%Wait 9 wks
North West
Region average 49% · median wait 12.1 weeks
- 1Barrow In FurnessBarrow-In-Furness · LA14 2PN69.6%Wait 6.4 wks
- 2Kendal (Oxenholme Road)Kendal · LA9 7RL65.1%Wait 8.9 wks
- 3WorkingtonCumberland · CA14 3YJ61.9%Wait 7.8 wks
- 4HeyshamLA3 2UZ59.2%Wait 18.3 wks
- 5CarlisleCA2 7AF58.7%Wait 13.8 wks
Scotland
Region average 49.3% · median wait 17.4 weeks
- 1Isle of TireePA77 6UH80.0%Wait 16.3 wks
- 2BallaterAB35 5QW77.1%Wait 20.9 wks
- 3Isle of MullPA72 6JD73.8%Wait 21.6 wks
- 4GairlochIV21 2BX73.5%Wait 8.3 wks
- 5PitlochryPerth and Kinross · PH16 5BX73.3%Wait 19.9 wks
South East
Region average 52.9% · median wait 11 weeks
- 1Tunbridge WellsTN1 2ES64.5%Wait 10.6 wks
- 2Lee On The SolentLee on the Solent · PO13 9JY63.2%Wait 18.9 wks
- 3ChichesterPO20 2FR61.6%Wait 3.7 wks
- 4MaidstoneME15 6JZ60.2%Wait 9.7 wks
- 5FarnboroughGU14 6UU59.7%Wait 19.6 wks
South West
Region average 51.7% · median wait 9.7 weeks
- 1Isles of ScillyTR21 0LW75.0%Wait 15.9 wks
- 2DorchesterDT1 3SU69.0%Wait 10.6 wks
- 3YeovilBA20 2EN63.4%Wait 13.1 wks
- 4Weston-super-MareWeston Super Mare · BS23 3PZ61.0%Wait 4 wks
- 5TauntonTA2 8RX59.5%Wait 12.6 wks
Wales
Region average 52.4% · median wait 7.3 weeks
- 1PwllheliLL53 5NT68.1%Wait 16.3 wks
- 2AbergavennyNP7 5HT64.2%Wait 3.9 wks
- 3BangorLL57 4YH62.2%Wait 10.9 wks
- 4BalaLL23 7SP61.6%Wait 16.1 wks
- 5BreconLD3 7RT58.7%Wait 7.4 wks
West Midlands
Region average 46.2% · median wait 11.9 weeks
- 1HerefordHR4 9NS58.8%Wait 2.9 wks
- 2LudlowSY8 1FD58.7%Wait 10 wks
- 3Birmingham (Shirley)Solihull · B90 4AA56.6%Wait 19 wks
- 4Burton on TrentBurton · DE14 2TG54.7%Wait 13.9 wks
- 5Birmingham (Cocks Moors Woods Leisure Centre)Birmingham · B14 6ER53.5%Wait 4.7 wks
Yorkshire and The Humber
Region average 50.4% · median wait 13.4 weeks
- 1MaltonYO17 7LB64.3%Wait 12.6 wks
- 2NorthallertonDL6 1NU60.4%Wait 14.3 wks
- 3BarnsleyS75 2DH58.5%Wait 7.3 wks
- 4KnaresboroughHG5 8QB58.5%Wait 6.9 wks
- 5SkiptonBD23 2BE57.3%Wait 13.8 wks
How to read this list
Each region lists its centres from the highest pass rate to the lowest. The big number is the car pass rate for 2025/26, coloured against the 50% Great Britain average: green is at least 3 points above it, red at least 3 below.
The wait under it is the median weeks between booking and test in the latest month DVSA has published. Open a centre for its address, test routes and yearly results, or a region for its map and league tables.
Every centre ranked by pass rate · Find the best centre near you